OBDII data for HVB

Ford Focus Electric Forum

Help Support Ford Focus Electric Forum:

This site may earn a commission from merchant affiliate links, including eBay, Amazon, and others.
brogult said:
I've noted that when the battery percent reads 100% I may not get regen, but as soon as it drops to 99%, I always do.
I've often had times where the display reads 100%, then 99%.... and still no regen. Eventually, regen does kick in, but I don't think 99 is the "magic" number.

Clearly though, regen is limited by the car detecting (somehow) that the battery is "too full".
 
michael said:
The result seems to be as you describe but I don't see why one should cause the other. Could the software be so simple-minded that it permits regeneration whenever the ETE is below some value? I hope not!
In reality the no regen is above a certain Abs SOC value. I asked a friend who's an engineer who has tracked & experienced capacity loss in his Fusion Energi and this is what he said:
SOC does not change with battery degradation. The car still charges to 100% SOC (if you charge while the car is running). The car will not regen with the SOC is 98.5% or above. The car charges the HVB up to a certain voltage and no more. SOC is a function of HVB voltage. The ETE at a particular voltage/SOC is lower when the battery is degraded.
I expect that the Focus Electric would function similarly.
 
Right, I understand and agree. When the battery fades, it basically becomes a smaller battery but with all the same characteristics of the original full-sized battery. That's why I'm puzzled about seeing regen immediately. I would have expected it to act as your friend described, except for his reference to 98% SOC. Obviously the battery is never allowed to reach that SOC, in my experience never above 90%. He may have been referring to the dashboard displayed battery percentage.

In my case, it did regen, even with the dashboard display at 100%.

In any case, this is a minor point. I'm pretty sure I'm seeing around 17kWh useful, compared to approximately 19.5 kWh useful which other are reporting for newer cars. So this represents a 12% capacity loss at 40K miles, 22 months, pretty much what I would expect. If this pace continues, I will still have better than 80% when I return the car at 36 months/59K miles. In a Leaf, this would represent the loss of just one battery bar (first bar lost at -15%, second at -21%)
 
michael said:
Right, I understand and agree. When the battery fades, it basically becomes a smaller battery but with all the same characteristics of the original full-sized battery. That's why I'm puzzled about seeing regen immediately. I would have expected it to act as your friend described, except for his reference to 98% SOC. Obviously the battery is never allowed to reach that SOC, in my experience never above 90%. He may have been referring to the dashboard displayed battery percentage.

In my case, it did regen, even with the dashboard display at 100%.

In any case, this is a minor point. I'm pretty sure I'm seeing around 17kWh useful, compared to approximately 19.5 kWh useful which other are reporting for newer cars. So this represents a 12% capacity loss at 40K miles, 22 months, pretty much what I would expect. If this pace continues, I will still have better than 80% when I return the car at 36 months/59K miles. In a Leaf, this would represent the loss of just one battery bar (first bar lost at -15%, second at -21%)
The Fusion Energi charges up to about 98.6-99.4% absolute SOC and the minimum possible SOC is 14.3%. While the Focus keeps the max discharge limit at 110 kW even when the HVB is very low, the Fusion gradually drops the discharge limit from 67 kW at a full charge down to about 52-55 kW, then it drops down to 35 kW when the SOC drops below 21.5%.

What all data are you able to access? You're using the special ScanGauge, correct? Are you able to see absolute SOC & volts? Perhaps I should add volts to my tracking of HVB stats on a full charge. I wonder if your volts are noticeably lower on a full charge since your ETE is lower.
 
michael said:
It's typically 350 V fully charged (varies slightly) and shows 89.5% SOC (also varies slightly)
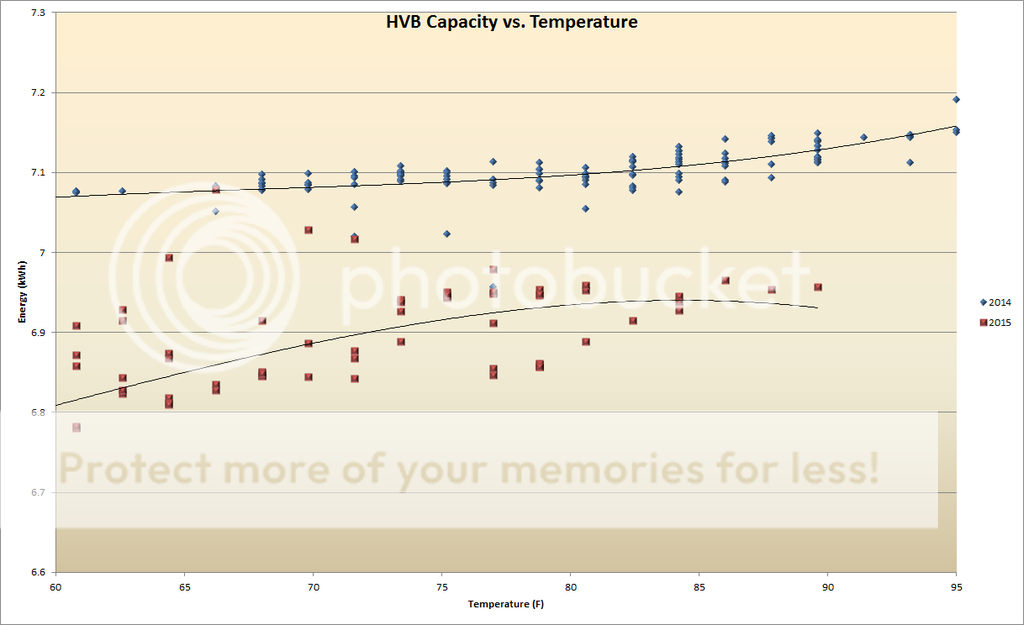
If you take ETE divided by abs SOC you can normalize capacity to 100% to make a chart like this:
larryh said:
I have recorded ETE (Energy to Empty) of the HVB each morning for the past two years. The following chart shows ETE (normalized to 100% SOC) vs. temperature. The blue markers are from last year. The red markers are for this year. You can see the the energy capacity of the HVB has decreased about 0.2 kWh from last year. The car is just over 2 years old with 25,000 miles. I don't have any data for the first year I owned the car, but I would have expected the capacity to be around 7.2 kWh that year. The total degradation is then approximately (7.2 - 6.9)/7.2 = 4%.


HVB%20Degradation_zpsedjxddfe.png
This is from: http://www.fordfusionenergiforum.com/topic/1683-obd-ii-data-for-hvb/page-8

I'm going to make a similar chart once I have enough data points for each vehicle.
 
I don't have confidence in the ETE value. It has remained relatively constant while the actual energy available (by the trip meter) has declined significantly more. A year ago, they were both 18.5. The ETE is now still well up in the 18s, but the actual available is around 17.

Furthermore, the ETE falls very rapidly in the first few miles of operation. This has been observed by others here, too.

I don't know how the software computes ETE, but I don't trust it.

I'm hoping Sefs will shed some light on this. I believe he once said there was an ETE calibrate function that he could access through his "official" software. Sefs once suggested using the full-blast heater rundown test as the best measure of actual battery capacity, and I find myself in agreement with him. When I run this test, it corresponds well with the actual capacity I see while driving. I find the ETE to be out-to-lunch.

I don't know anything about Fusion, and I would be reluctant to assume exact correspondence with Focus function.
 
I know this forum isn't working often these days, but if someone is in the LA area and has a FORSCAN, I would really like to meet with you to take a reading. Please PM me with contact info if so.

Thanks!
 
michael said:
I don't have confidence in the ETE value. It has remained relatively constant while the actual energy available (by the trip meter) has declined significantly more. A year ago, they were both 18.5. The ETE is now still well up in the 18s, but the actual available is around 17.
How do you read the ETE... with FORScan? Which PID is it?
 
No, with my Scan Gauge. I don't have a Forscan. I'm interested to see if Forscan and ScanGauge report the same ETE, also to get cell balance info that ScanGauge doesn't provide.

ScanGauge gives me only limited FFE specific information:

Batt temp, Battery Voltage and current, ETE, battery age, SOC...I think that's about it.


Also, as I have indicated and some others have mentioned, the reported ETE drops rapidly over the first few miles, much faster than the reported consumption goes up. This causes me to be puzzled about how the ETE is calculated (or estimated).
 
WattsUp said:
michael said:
I don't have confidence in the ETE value. It has remained relatively constant while the actual energy available (by the trip meter) has declined significantly more. A year ago, they were both 18.5. The ETE is now still well up in the 18s, but the actual available is around 17.
How do you read the ETE... with FORScan? Which PID is it?
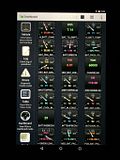
In FORScan it can be seen in the top row of my pic. These are all the PIDs from the BECM that I display.


michael said:
No, with my Scan Gauge. I don't have a Forscan. I'm interested to see if Forscan and ScanGauge report the same ETE, also to get cell balance info that ScanGauge doesn't provide.

ScanGauge gives me only limited FFE specific information:

Batt temp, Battery Voltage and current, ETE, battery age, SOC...I think that's about it.


Also, as I have indicated and some others have mentioned, the reported ETE drops rapidly over the first few miles, much faster than the reported consumption goes up. This causes me to be puzzled about how the ETE is calculated (or estimated).
Besides cell balancing info, I'd also be interested in what your car shows for voltage variation.
 
Voltage variation
One of the ways to identify HVB health is to monitor voltage variation. The higher the variation the more taxing it is for the battery. When the variation increases the weaker cells are being more heavily taxed which makes them even weaker. In the Focus Electric the voltage variation always shows 0.01 as a minimum. The voltage variation increases by 1/100th of a volt for each 17 kW or so of power from the HVB. When the HVB SOC is low the variation goes up.

I can tell that the Focus Electric pack, with 15,000+ EV miles, is weaker than the Fusion Energi pack with its ~5000 EV miles. Another point of reference: the Focus Electric reports 2438 kWh used from the HVB is the ~11,000 miles we've had it. The Fusion Energi reports 1085 kWh used in the ~12,000 miles we've had it.

The Fusion Energi voltage variation usually shows 0.00 in FORScan. With Torque Pro I can see 3 decimal places for the voltage variation, the number reported by the BECM. The Energi voltage variation at rest is usually 0.003 volts, compared to the Focus which is 0.01 volts. It takes about 23-25 kW of power draw for the HVB to make the Fusion Energi pack voltage variation increase to 0.02, compared to 17 kW in the Focus.

I'm curious what a new Focus Electric would report for voltage variation.
 
The ScanGauge doesn't report variation, that's why I'm hoping there is someone nearby who would hook up their Forscan and do a reading.
 
Now that temps are dropping into the 40s, I'm able to gather some more data about the thermal mass of the HVB. The Focus HVB has a much higher resistance to temperature change than the smaller HVB in our Fusion Energi (just stating the obvious). This means that the Focus HVB is less impacted by external temp when parked & also less impacted by charging or discharging.

For example, our Fusion Energi HVB will heat up while driving, even on the coldest days. The Focus Electric battery will drop in temp while driving on the cold days. Yesterday morning, the HVB temp was 73 when leaving home. By the time I had used up about half of the HVB charge, the temp was down to 64. Some of this drop is while sitting. But I also regularly observe the HVB temp drop while driving with colder ambient temps. The heat from discharging the HVB is not enough to overcome the cold ambient air temp, causing the HVB temp to fall, even while being discharged.

This can have an impact on your range, since a cold HVB has less energy storage capacity.
 
Yes I have the same impression. During the heat of the summer (over 100) when parked the battery temp would remain quite constant. I think the battery is large and well insulated.

The biggest contributor to battery heating seems to be the latter stages of charging. If you want to depart in the morning with a somewhat warmed battery, try doing a late charge. I charge from about 5 AM to maybe 730 most mornings and depart around 8 with the battery usually in the 80's or even 90's if the night wasn't cold.
 
With the recent FORScan update decimal places can be configured for displays. I can now see 3 decimal places of voltage variation, enabling me to measure it in millivolts (mV). At rest, our HVB usually shows about 8-12 mV of cell voltage variation. The Fusion Energi usually shows about 4-8 mV of variation. Under a load of about 100 amps the Focus Electric variation jumps to 20-30 mV. This is fairly consistent whether discharging (acceleration) or charging (regen braking) the HVB. As the HVB discharges, the voltage variation at rest increases. When reaching the SSN message and an ETE of 0.000 kWh the cell variation is at least 100 mV.

The Focus Electric mV variation at a full charge doesn't seem to be any higher than it is when at 75%, 50%, 25%, etc. The Fusion Energi has higher voltage variation at a full charge than it does at 75%, 50%, 25%, etc. I believe this is because a full charge in the Focus Electric is only up to about 90% of HVB capacity, whereas a Fusion Energi full charge is closer to 95% of HVB capacity.

I reported in another thread that once the HVB charge is below about 15% displayed, the charge drops really fast. Friday night we were 6.3 miles away from home with 11% charge displayed remaining. It should have been no issue to get home. The ETE reported about 2.05 kWh. This particular drive we make multiple times a week and it takes 1.2-1.5 kWh without using HVAC. We started driving with the HVAC off. After about 2 miles we were down to 0.6 kWh remaining ETE & 4% displayed SOC. We had to stop & charge. Fortunately there's a free L2 EVSE at Goodwill that we drive right by on our way home. We stopped and charged for a few minutes there & made it home.

Yesterday I began a 6.4 mile trip home with 12% displayed SOC & about 2.25 kWh ETE. I should have been able to use heat, as the outbound trip from home only used 1.2 kWh & there's no real elevation change. I didn't use HVAC & I hit the SSN about a block from home. The trip home used 1.5 kWh according to the MFM trip log, but used up 2.25 kWh of ETE. The ETE hits 0.000 kWh just after the SSN message appears.

The car measures its SOC when discharging based on the lowest cell voltage level. The car measures its SOC when charging based on the highest cell voltage level. As the HVB degrades & voltage variation increases, you will lose capacity at both ends. This results in the full charges not going as high & a reduction in how far you can discharge the battery. As the weak cells continue to get weaker, their voltage variation will increase & further compound the issue.

I am very concerned with the amount of capacity loss that we're seeing in the Focus with so few miles (only 19,000).

The Lifetime kWh used by the Fusion is up to 1446 kWh through 10/31/15. The Focus is up to 3309 kWh from when we got it on 7/3/14 through 10/31/15.
 
It's not exacty true that you lose capacity on both ends because all good charging systems have a mechanism to balance the cells. There are different approaches, but typically when any given cell reaches its maximum allowed charging voltage (typically 4.1 V but varies with design) that cell is changed to constant Voltage mode. The remaining cells are allowed to continue to charge until each of them also reaches the desired Voltage.

During discharge, the weakest cell hits the lowest allowable Voltage first, and discharge is stopped, even though other cells may be still going strong. So the weakest cell in general controls the entire pack's capacity. I'm speculating that may be what you are seeing, and possibly that is the kind of thing that warranty might cover???

One could envision a scheme in which cells which reach full discharge are removed from the pack and the remaining cells allowed to soldier on. In the case of a few weak cells, this would prolong the life of the pack. If you have 99 cells with remaining energy and one exhausted one, why give an SSN message??
 
michael said:
During discharge, the weakest cell hits the lowest allowable Voltage first, and discharge is stopped, even though other cells may be still going strong. So the weakest cell in general controls the entire pack's capacity. I'm speculating that may be what you are seeing, and possibly that is the kind of thing that warranty might cover???

One could envision a scheme in which cells which reach full discharge are removed from the pack and the remaining cells allowed to soldier on. In the case of a few weak cells, this would prolong the life of the pack. If you have 99 cells with remaining energy and one exhausted one, why give an SSN message??
What do you see for voltage variation when nearing a full discharge? What do others see?

I'm really curious to hear what others see for typical voltage variation at various SOCs, please chime in with your numbers & miles on your FFE if you can access this data. Thanks!
 
Ideally these measurements should be made both when stopped and a maximum power.

Even if the cells have identical open circuit Voltage, if the effective series resistance increases then the drop in Voltage under load will increase.
It's been a while since I played with Forscan, but my recollection that it displayed

Pack Voltage
Minimum cell Voltage
Variation max to min cell


So I noted these values at rest and during a 40-70 MPH full throttle run

The pack Voltage divided by the number of cells gave the average cell Voltage

In my case, as I recall, the whole pack sagged under load, but the minimum stayed close to the average and the span stayed around 10 mV. So I concluded my battery was healthy but getting old.

I will try to re-test for you, but can't do it til next week.


MORE....

I found my post from July....I said

I took my morning commute today with the Forscan running. What I noticed was variations in the maximum cell variation.


At rest, it was 0.01, but while driving it reached higher levels. At the application of full throttle, it would reach 0.08, occasionally 0.10 for a few seconds, and then reduce to perhaps 0.07 or even less after a few seconds of continuing full throttle. Obviously I couldn't hold full throttle for too long as speed got too high.

I see this as variations in the internal resistance of the cells. What I don't have any feeling for is how my value compares with what others are seeing. Anybody have insight in this?

I saw these variations both shortly after leaving home (with battery still almost fully charged) and later in the commute (with SOC in the 30% range).

At rest, late in the commute, imbalance was typically 0.02.

Also, the results I'm seeing from Forscan do agree with what my Scan Gauge has been showing. I had speculated that there was some scaling error in one or the other that explained why I was seeing only 18.2 kWh or so ETE while other were showing higher, but this turns out not to be so. Both Forscan and ScanGauge agree on this lower value.


Note also that my battery is noticeably weaker now than it was in July. The summer did it significant harm. The reported ETE now is aroujnd 17 and the actual is in the 15's
 
Back
Top